Quick Start Guide
This Quick Start Guide will help new users get started running their first accessibility analysis using the LUPTAI model. Before beginning this guide you will need following:
LUPTAI to be installed, for steps on installing LUPTAI see our installation guide.
A copy of the sample project, see here
Open the LUPTAI Plugin
After installation is complete, you will find the LUPTAI Menu, in the menu bar of QGIS.

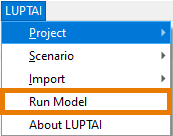
From this menu you can access all of the LUPTAI QGIS plugin’s functionality. Clicking on the LUPTAI menu button will bring up a menu as shown below:
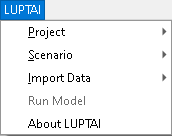
We will briefly touch on some these sub-menus and options throughout this Quick Start guide, more in depth information can be gained on the LUTPAI QGIS features elsewhere within the documentation.
Open a LUPTAI Project
All analysis using the LUPTAI Plugin must be performed from within a project, each project has it’s own folder which both defines the project and contains its data. The project we will use in this quick start guide is the sample project, available here.
To open the sample project, open the LUPTAI menu from QGIS, then click on “Project’. This will bring up the Projects submenu, from there click “Open a Project”.
A file browser will open. Using the browser, navigate to the location of the sample project, select the project folder and click select folder.
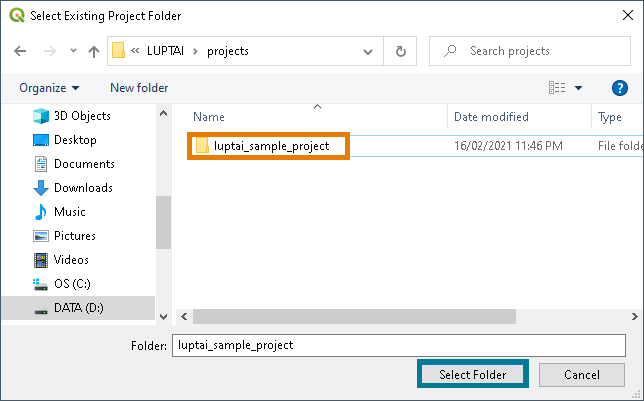
We have now loaded the sample project in to LUPTAI for QGIS. For more information on projects, their structure, and how to create them, see our projects guide.
Loading a Scenario
Each LUPTAI project can have multiple scenarios, each of these contain all the vital information needed to perform accessibility analysis, such as networks and timetables.
Now that we have a project open, let’s load a scenario into the workspace so that we can have a look around. To do this, click on Scenario from the LUPTAI menu, then click on Load a scenario.
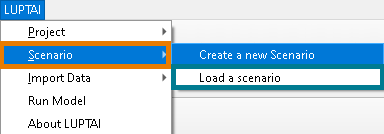
From there a window will appear with a drop down menu, that lists the available scenarios. Choose the “SEQReference (VLC)” scenario and then press OK. The scenario will then load into the workspace.
Exploring the Workspace
Now that we have the scenario loaded into the workspace, let’s have a look around. Within the Layers panel of QGIS, all the layers loaded from scenario are listed. All these layers can be explored and edited using typical QGIS tooling, but be careful as the layer data will be used when you perform a model run.
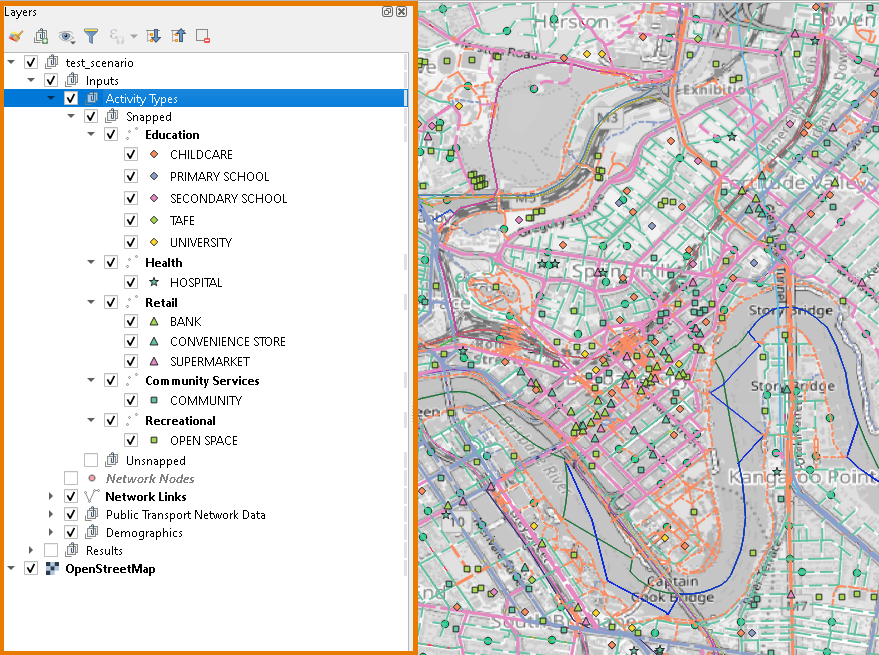
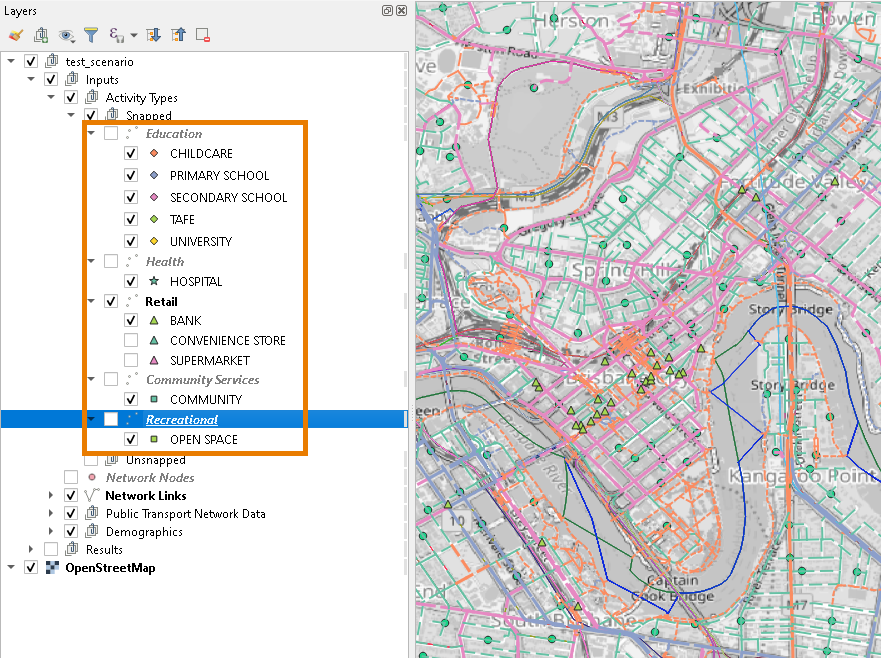
Activity points, transport links, etc. have icons which differ based on their type. To make navigating easier, you can hide layers and categories, by unchecking their associated checkbox in the layers panel. As an example, in the image below we have deselected all activity points that aren’t banks.
Performing a Model Run
Now, let’s perform an accessibility model run. For this quick start we will just do a simple walk accessibility analysis. To bring up the run model dialog click Run Model from the LUPTAI menu.
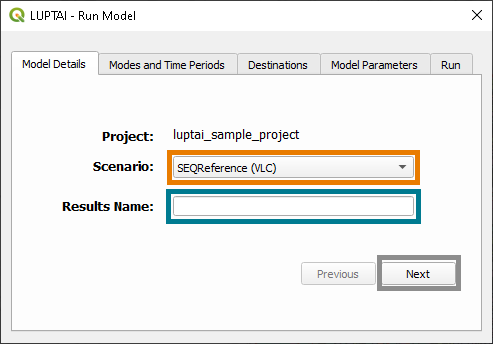
On the first tab (“Model Details”) of the run model dialog box ensure that SEQReference (VLC) is selected as the scenario. Type “first_test_run” as the the Results Name and then click the Next button.
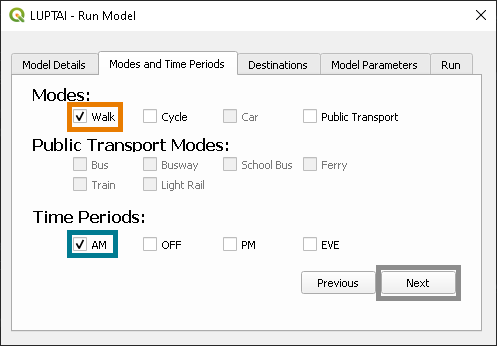
In the next tab (“Modes and Time Periods”) we choose the mode and the time period that the run will occur over. Check the Walk checkbox to select walk as the mode. Next, check the AM checkbox to select the AM (morning) time period, and then click the Next button.
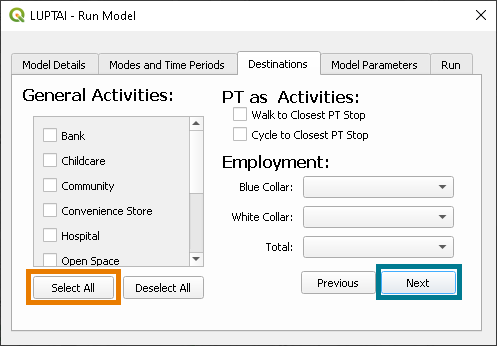
In this tab (“Destinations”) we choose the destinations that we will be performing accessibility analysis for. We will use all the “General Activities” for this quick start model run. Click the Select All button to select all the general activities, then click Next.
The next allows us to adjust the model parameters to be used in the model run. We will leave these as the default values, so click the Next button.
The final page provides the conditions of use for performing accessibility analysis using LUPTAI. Read these conditions carefully and, if you accept them, check the checkbox “I accept” (note, that you must accept the conditions for use to run a LUPTAI model).
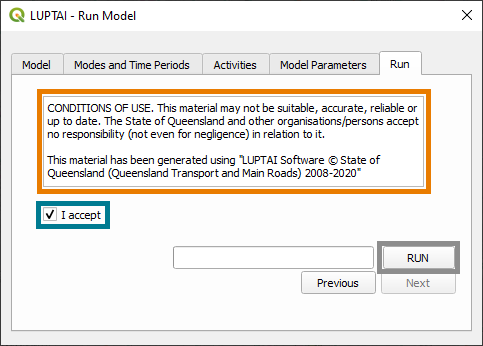
This will begin the model run. You can follow the progress through both the run dialog box and the LUPTAI Model run dialog that will appear. The results of the model run will automatically be shown in the QGIS map window.
Now that we know the basics of loading a scenario and running a model we’ll do something a bit more advanced, modifying the network to see how it changes the accessibility of areas. Before we do that we should create a new scenario to contain the modified network.
Creating a New Scenario
To create a new scenario from the LUPTAI menu, click “Scenario” and then “Create a New Scenario”. This will bring up the create a scenario dialog. We will create a scenario based on the scenario we ran the model on, to do this select “SEQReference” from the Parent Scenario drop down box. Enter a name of this scenario, such as “MyNewScenario”, in the Scenario Name text box and put your name in the Created By text box. And press the OK button.
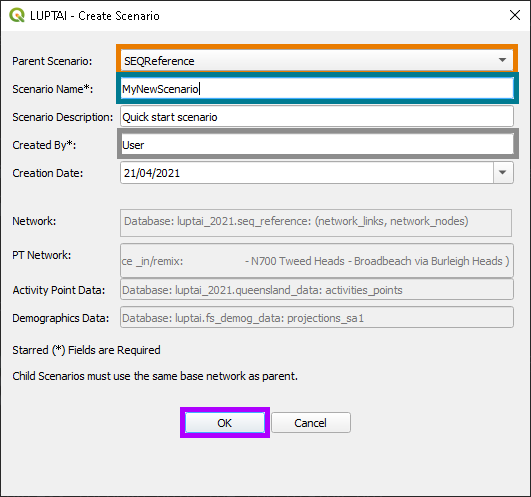
After a few moments the new scenario will be created.
Modifying the Network
Let’s make an adjustment to the active transport network, we’ll remove the Story Bridge (I doubt anyone will notice it’s missing). In the layers panel select the network links layer, ensure that the network links layer belongs to our newly created scenario, by checking that it is at the top of the layer tree that the network links is in.
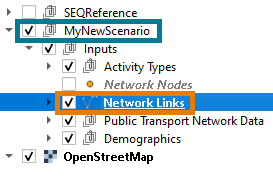
Next click the edit layer button in the digitizing toolbar of QGIS.

Then click the select features button in the attributes toolbar of QGIS.

Now, navigate the map to the story bridge and click on a link that belongs to the Story Bridge, then press the delete key on the keyboard.
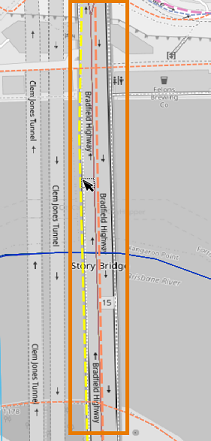
Now do this for all links that comprise the Story Bridge.
Then click the save layer button to save our changes.

Running a Model on a Second Scenario
Let’s run the model on our modified network. We will run it the same as previously, except on the first tab we must make sure that scenario yyy is selected in the scenario drop down list and that we have given it a different scenario name in the scenario name textbox
After running the new scenario we can compare the results to the previous run. You will notice that accessibility has decreased around Kangaroo Point in the new scenario, as compared to the original scenario. Not a surprising result as the Story Bridge is the most direct active transport link between Kangaroo Point and the CBD.

This concludes the quick start guide. For more information on the range of possibilities available in the LUPTAI QGIS Plugin, check out some of the other documentation available in the left sidebar.