Transit Metrics Estimation
Table of contents
Transit Metrics Workflow
After the data is ingested by the data preparation stage above, a series of data cleaning and transformation operations are applied to estimate key transit metrics, such as travel time, load, boardings and alightings. This phase is handled by the Transit Metrics Module, which first calculates the metrics at the stop-to-stop level and then maps them onto the corresponding road network.
To generate these metrics, the Jupyter notebook 1_produce_curated_data.ipynb is used. This notebook instantiates the TransitMetrics class and runs two primary methods:
produce_stop_to_stop_measures()produce_link_measures()
The produce_stop_to_stop_measures()method generates stop-to-stop metrics as below:
- Stop-to-stop travel times
The estimated actual time it took for a vehicle to travel between two consecutive stops. - Stop-to-stop scheduled travel times
The time scheduled for a vehicle to travel between two consecutive stops, based on the GTFS timetable input data. - Passenger load
The number of passengers boarding or alighting at each stop and the number of passengers on board of a vehicle between two consecutive stops.
To generate the above metrics, the following inputs are required:
- GTFS Timetable Data (
gtfs_timetable_df)
This contains scheduled stop sequences and times for each transit service (trip). It’s used to estimate the scheduled travel time and align that with the actual travel time of services. - Transaction Stop Time Data (
transaction_stop_time_df)
Ticketing data showing the actual time vehicles arrived at each stop calculated based on the transaction times. - Trip Stop Timing Data (
trip_stop_timing_vehicle_time_df)
Provides vehicles’ arrival and departure times at each stop. This is used in conjunction with the transactions’ vehicles time to form the actual arrival and actual departure times. - Transaction Stop Load Data (
transaction_stop_load_df)
Contains the number of passengers boarding or alighting at each stop. This helps calculate the load at each stop.
When the produce_stop_to_stop_measures() method is called, it saves its output (the stop-to-stop metrics) locally in the directory 4_outputs\1_stop_to_stop_outputs, under a structured partition based on the analysis period, region, year, month and day.
Once the stop-to-stop metrics are saved, the produce_link_measures() method can be called. This method reads the outputs saved by the produce_stop_to_stop_measures() method from the local drive and maps them onto the road network. The link-based measures are then saved in the 4_outputs\2_travel_time_split folder, using a partitioned structure similar to the stop-to-stop outputs.
Below is the folder structure where the outputs of the transit metrics are saved:
|   +-- 4_outputs
|   |   +-- 1_stop_to_stop_output
|   |   |   +-- [YYYMMDD]
|   |   |   |   +-- region=SEQ
|   |   |   |   |   +-- Year=[YYYY]
|   |   |   |   |   |   +-- Month=[MM]
|   |   |   |   |   |   |   +-- Day=[dd]
|   |   |   |   |   |   |   |   +-- stop_to_stop_measures.parquet.gz
|   |   +-- 2_travel_time_split
|   |   |   +-- [YYYMMDD]
|   |   |   |   +-- region=SEQ
|   |   |   |   |   +-- Year=[YYYY]
|   |   |   |   |   |   +-- Month=[MM]
|   |   |   |   |   |   |   +-- Day=[dd]
|   |   |   |   |   |   |   |   +-- link_based_measures.parquet.gz
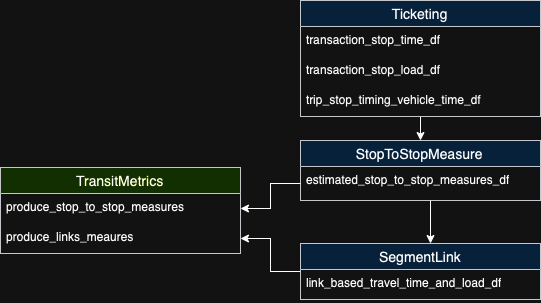
Below image shows the class relationship between the TransitMetric interface and the two other classes of the StopToStopMeasures and SegmentLink classes using the products of Ticketing class to perform their operation.

Primary measures such as estimated and scheduled travel times between the stops as well as the actual boarding and alighting per stop, per trip are produced before they are transferred to the link network (HASTUS street segments).
The section below describes the steps undertaken to estimate these measures in more detail.
High-Level Steps for Estimating Travel Time
-
Estimating Vehicle Times: Converting transaction times into vehicle arrival and departure times at each stop. Then transactions’ vehicle times are matched with the GTFS timetable, resulting in a comprehensive dataset that includes all stops even if they were not recorded in the transaction records. Next, this dataset is merged with the trip stop timing vehicle data (
trip_stop_timing_vehicle_dataframe) to incorporate the vehicle_arrival_time and vehicle_departure_time fields. These fields are used in the next step to estimate the actual arrival and departure time in cases where transaction data is unavailable. -
Estimating the Actual Arrival and Departure Time: Actual (or estimated) arrival and departure times are based on transactions’ vehicle times when available. Otherwise, they are approximated using the mid-geofence time added to vehicle times, as indicated in the Trip Stop Timing Report (see
StopToStopVehicleTime.enriched_transaction_veh_arrival_departure_time). -
Identifying Stops within the First and Last Actual Stops: Actual arrival and departure times are not always available. The first and last actual stops are defined as the initial and final stops in a trip where both actual arrival and departure times are available.
-
Handling Null Values in Actual Arrival and Departure Times within the First and Last Actual Stops: When actual arrival and departure times are missing for stops between the first and last actual stops, the missing values are interpolated. The stops are grouped into
SectionIDs, which are used to interpolate the travel time. -
Estimating Travel Time (per Section): Travel time per section is estimated using the updated actual arrival and departure times. A section could be as small as one stop-to-stop segment or could consist of multiple consecutive segments in a trip (see
StopToStopTravelTime.estimated_sections_travel_time_df). -
Interpolating Travel Time (Link Level): Travel time per section is distributed to the street segment links proportionally based on the link length, with travel time allocated according to each link’s length within the section.
High-level Steps for Estimating Patronage Data
-
First, the stop-level activities are derived from transaction analysis (
ticketing.get_transaction_stop_load_dataframe). -
Then, simple adjustments are made to the boarding and alighting numbers, as follows:
- No boarding is allowed at the last stop, so the last stop boarding is set to zero.
- At the first stop, the number of alighting passengers cannot exceed the number of boarding passengers.
- The total boarding and alighting numbers are balanced for each trip.